Supply Chain & Operations
Operations performance that shows up in EBITDA and cash.
For sponsors and corporates: procurement, manufacturing, logistics, planning and working capital, delivered by senior operators with AI-enabled analytics built in.
Ways to engage
Fixed scope, clear deliverables, fast start.
Each offer is scoped and priced as a fixed fee once we understand your situation. Pick the problem; we bring the team.
SCOR DS Accelerator
Maturity assessment, SCOR DS workshop on your processes, and a roadmap your team owns.
- ASCM maturity assessment, 27 focus areas
- SCOR DS executive workshop
- Prioritized roadmap and charter
Procurement Savings Sprint
Spend baselined to invoice level, suppliers consolidated, savings in EBITDA.
- Spend cube and should-cost
- RFx and negotiations
- Part of the fee tied to savings
S&OP in 90 Days
One monthly plan across demand, supply and finance, run by your team.
- Process, roles and business rules
- Forecast accuracy baseline
- Planning tool fit, vendor agnostic
Working Capital Release
Inventory and terms reset without hurting service.
- Segmentation and safety stock
- DIO, DPO and DSO levers
- Cash tracked to the balance sheet
How much cash is sitting in your supply chain?
Estimate the cash you could release from inventory, receivables and payables in two minutes.
Capabilities
Six levers, one operating rhythm.
Procurement & Strategic Sourcing
Spend cubes, supplier consolidation, rate resets and MSAs that convert savings into EBITDA.
What’s included
- Spend cube and category baseline in 2 to 3 weeks
- Supplier consolidation, should-cost and negotiation support
- Rate resets, MSAs and contract compliance
- Savings tracking tied to the P&L and EBITDA bridge
Manufacturing & Operations
Plant performance, footprint and site consolidation paced by strategic value, not disruption.
What’s included
- OEE, capacity and bottleneck diagnostics
- Footprint and site consolidation business cases
- Production scheduling and capacity planning
- Operational continuity through integrations and moves
Logistics & Distribution
Network design, carrier and 3PL strategy, and logistics cost to serve.
What’s included
- Network design and DC footprint
- Carrier and 3PL strategy, RFPs and rate benchmarks
- Cost to serve by customer, channel and SKU
- Transport and warehouse KPIs and governance
S&OP / IBP & AI Planning
Planning cadence, forecast accuracy and service levels, with AI-enabled demand and tactical planning.
What’s included
- S&OP and IBP design: calendar, roles, decision rights
- Demand planning and forecast accuracy improvement
- AI-enabled planning with John Galt or Demand Chain AI
- Planner training through MG Academy and ASCM
Working Capital & Cash
DIO, DPO and DSO levers that shorten cash-to-cash and release cash.
What’s included
- Inventory policy by segment: safety stock, lot sizes, MOQs
- Payment terms harmonization and DPO levers
- Order-to-cash and DSO improvements
- Cash release tracked week by week
Technology Business Cases
ERP and planning-system cases with ROI an investment committee can underwrite.
What’s included
- Vendor-agnostic ERP and planning-system selection support
- ROI and business case an investment committee can underwrite
- SCOR DS process blueprint before design and go-live
- Benefits tracking after go-live
Our signature supply chain diagnostic
The SCOR DS Accelerator: assess, train, transform.
One package that gives your leaders a common language for the supply chain, a fact-based view of where you stand, and a roadmap they own. The ASCM maturity assessment is complimentary when you book the SCOR DS workshop. It is the same program we delivered for a global MedTech supply chain center of excellence.
ASCM Supply Chain Maturity Assessment
- 27 focus areas across 7 SCOR domains
- Facilitated with your leaders in about 2 hours
- Results review within 2 weeks
SCOR DS executive workshop
- Taught on your own Level 3 to 4 process maps
- Metrics aligned to SCOR, with optional SCORmark benchmark
- Process disconnects traced to root cause
Portfolio, 90-day plan and charter
- Findings themed into foundation programs
- Leadership decisions and owners
- 12 to 24 month roadmap, extendable through ASCM TLP
What your team gets
Where you stand, area by area
27 focus areas across 7 SCOR domains, scored from reactive to leading.
How you compare with peers
| Attribute | Metric | You | Peer target |
|---|---|---|---|
| Reliability | Perfect order fulfillment | 86% | 92% |
| Responsiveness | Order fulfillment cycle time | 9 days | 6 days |
| Agility | Upside adaptability | 18% | 20% |
| Cost | Total supply chain cost | 11.2% | 10.5% |
| Assets | Cash-to-cash cycle time | 74 days | 58 days |
Level 1 metrics against ASCM’s benchmark database, with parity, advantage and superior targets.
Where processes break down
Level 3 to 4 process maps of your current state, with every disconnect traced to a root cause.
A plan your team owns
100+ findings themed into a prioritized portfolio, a 90-day plan and a transformation charter.
Illustrative outputs with sample data. Your deliverables use your own processes, metrics and systems.
AI-enabled planning, embedded
Better forecasts inside the S&OP you already run.
We embed AI-enabled demand and tactical planning into S&OP and IBP, working with planning technology partners such as John Galt and Demand Chain AI, and stay vendor agnostic on the final choice.
- Forecast accuracy and service levels, up in weeks
- Inventory sized to real demand, releasing cash
- Planners trained to run it after we leave
OptiFlow AI · now enrolling pilot partners
Find exactly where your operations lose money.
OptiFlow AI is our cost-diagnostic engine. We connect your ERP, WMS and MES data into a cost twin, simulate scenarios, and map the savings paths dashboards miss, then help you capture them.
By SKU, supplier and mode, so pricing and sourcing decisions rest on real cost.
Line downtime and throughput, freight mode mix and cost per mile.
Balance inventory cost against service, and free cash across DIO, DSO and DPO.
How it works
- Connect your ERP, WMS and MES data.
- Build your cost twin.
- Simulate scenarios and map savings paths.
- Act on prioritized recommendations, with outcomes tracked.
Built for
- Heads of supply chain at mid-market manufacturers and distributors
- PE operating partners running 100-day plans and integrations
- CFOs and COOs tired of chasing savings in spreadsheets
Pilot partners get
- Early access to the platform and roadmap
- A say in the features we build next
- Founding-partner pricing, locked in
- Dedicated onboarding and savings support
Technology partners
Partnered, yet vendor agnostic.
We recommend the planning technology that fits your business, not a preferred one. When it fits, these partners let us move from design to working tools fast.
John Galt Solutions
The Atlas Planning Platform: AI-driven demand, inventory and supply planning in one SaaS platform, recognized in the Gartner Magic Quadrant for Supply Chain Planning. A strong fit for mid-market S&OP and IBP.
Schedule a John Galt demoDemand Chain AI
PULS8, an AI planning suite for consumer goods companies covering demand forecasting, trade investment and supply optimization, with real-time insight across the demand chain to lift forecast accuracy and right-size inventory.
Schedule a Demand Chain AI demoAlso: ASCM Authorized Consulting & Training Partner for SCOR DS, maturity assessments and benchmarks.
The analytics layer, in practice
A control tower sponsors can audit.
The savings and EBITDA tracker we run on procurement and value-creation programs: invoice-validated run-rate, gated upside kept separate, one-time credits out of EBITDA, and the next step on every negotiation. Shown with illustrative data and masked vendors.
Confirmed, invoice-validated EBITDA of $1.1M to $1.8M a year. A further $0.5M to $1.0M is gated and never added to the confirmed figure.
EBITDA by lever, low to high
Confirmed and gated shown together for scale, never summed.
By supplier
Spend in scope, value range and where each negotiation stands.
| Supplier | Spend | Confirmed range | Status |
|---|---|---|---|
| Supplier A MRO & industrial | $8.4M | $0.42M to $0.61M | MSA signed |
| Supplier B Packaging | $5.1M | $0.31M to $0.52M | In redline |
| Supplier C Freight & logistics | $7.2M | $0.26M to $0.48M | Proposal out |
| Supplier D Indirect services | $3.9M | $0.12M to $0.21M | Validating |
Case studies
Supply chain transformations, by the numbers.
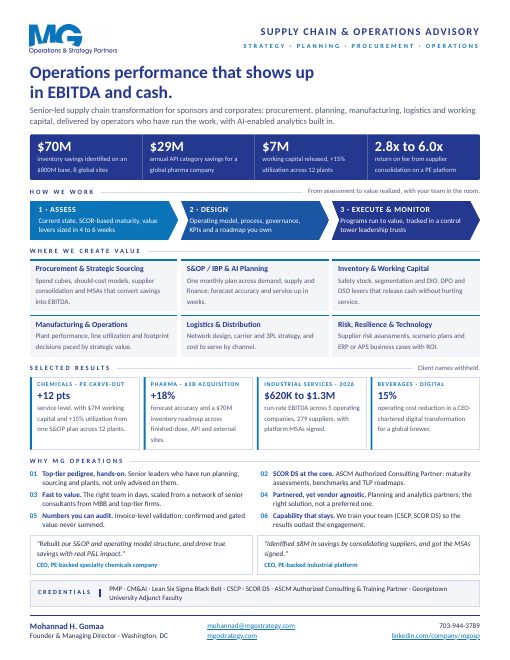
return on fee from supplier consolidation across five operating companies.
Read the case study →production utilization and $7M working capital from one S&OP plan across 12 plants.
Read the case study →inventory savings and +18% forecast accuracy across eight global sites.
Read the case study →annual savings from should-cost modeling and supplier consolidation.
Read the case study →operating cost reduction from a CEO-chartered digital transformation.
Read the case study →supply chain strategy and roadmap for a leading U.S. beer business.
Read the case study →faster time to market for new products across three business units.
Read the case study →working-capital value behind a $150M IBP business case.
Read the case study →Where is cash or margin leaking in your operations?
Thirty minutes with Mohannad Gomaa, Founder & Managing Director. Bring the numbers; we will show you where to look first.